Average Commute Time by State

Average Commute Time by State
Ranking - Infrastructure
New York has the longest average commute at 33.5 minutes. South Dakota is shortest at 17.3 minutes.
Quick Answer
Average Commute Time by State
-
1
Average commute time by state is highest in New York at 33.5 minutes one way.
-
2
South Dakota is lowest at 17.3 minutes. New York commuters spend 16.2 more minutes getting to work than South Dakota commuters.
-
3
New York also has the highest public transit share at 28.0%, while Alabama has the highest drive solo share at 86.3%. Hawaii has the top carpool share at 14.7%.
Map
Average Commute Time by State Map

| Rank | State | Minutes |
|---|---|---|
| 1 | New York | 33.5 |
| 2 | Maryland | 33 |
| 3 | New Jersey | 32 |
| 4 | Massachusetts | 30 |
| 5 | California | 29.8 |
| 6 | Illinois | 29 |
| 7 | Georgia | 28.7 |
| 8 | Virginia | 28.6 |
| 9 | Washington | 28 |
| 10 | Florida | 27.9 |
| 11 | New Hampshire | 27.4 |
| 12 | Hawaii | 27.1 |
| 13 | Pennsylvania | 27.1 |
| 14 | Connecticut | 26.7 |
| 15 | Texas | 26.6 |
| 16 | Delaware | 26.2 |
| 17 | West Virginia | 26.1 |
| 18 | Arizona | 25.8 |
| 19 | Colorado | 25.8 |
| 20 | Louisiana | 25.8 |
| 21 | Tennessee | 25.4 |
| 22 | Rhode Island | 25.3 |
| 23 | Alabama | 25.2 |
| 24 | Mississippi | 25.2 |
| 25 | South Carolina | 25.1 |
| 26 | North Carolina | 24.9 |
| 27 | Michigan | 24.6 |
| 28 | Nevada | 24.6 |
| 29 | Maine | 24.3 |
| 30 | Indiana | 23.9 |
| 31 | Missouri | 23.9 |
| 32 | Oregon | 23.9 |
| 33 | Minnesota | 23.8 |
| 34 | Kentucky | 23.7 |
| 35 | Ohio | 23.7 |
| 36 | Vermont | 23.3 |
| 37 | New Mexico | 22.7 |
| 38 | Wisconsin | 22.2 |
| 39 | Oklahoma | 22 |
| 40 | Utah | 22 |
| 41 | Arkansas | 21.8 |
| 42 | Idaho | 21.2 |
| 43 | Kansas | 19.6 |
| 44 | Iowa | 19.5 |
| 45 | Alaska | 18.9 |
| 46 | Nebraska | 18.9 |
| 47 | Montana | 18.4 |
| 48 | Wyoming | 17.9 |
| 49 | North Dakota | 17.6 |
| 50 | South Dakota | 17.3 |
New York leads at 33.5 minutes, followed by Maryland at 33.0 and New Jersey at 32.0. South Dakota is lowest at 17.3 minutes, with North Dakota at 17.6 just above it.
Average Commute Time by State Table
50 entries


No matching entries
Adjust the filter to show more entries.
|
Rank
|
State
|
Average Commute (min)
|
Carpool (%)
|
Drive Solo (%)
|
Public Transit (%)
|
|---|---|---|---|---|---|
| 1 |
New York
|
33.5 | 6.3 | 53.1 | 28.0 |
| 2 |
Maryland
|
33.0 | 8.8 | 74.3 | 7.9 |
| 3 |
New Jersey
|
32.0 | 8.2 | 70.9 | 11.7 |
| 4 |
Massachusetts
|
30.0 | 7.4 | 69.8 | 10.2 |
| 5 |
California
|
29.8 | 10.0 | 73.8 | 4.9 |
| 6 |
Illinois
|
29.0 | 8.3 | 72.7 | 9.4 |
| 7 |
Georgia
|
28.7 | 9.4 | 79.4 | 2.0 |
| 8 |
Virginia
|
28.6 | 9.1 | 76.7 | 4.5 |
| 9 |
Washington
|
28.0 | 9.8 | 71.0 | 7.0 |
| 10 |
Florida
|
27.9 | 9.4 | 79.1 | 1.7 |
| 11 |
New Hampshire
|
27.4 | 7.4 | 80.8 | 0.9 |
| 12 |
Hawaii
|
27.1 | 14.7 | 67.3 | 5.7 |
| 13 |
Pennsylvania
|
27.1 | 8.5 | 75.6 | 5.8 |
| 14 |
Connecticut
|
26.7 | 8.1 | 77.9 | 4.4 |
| 15 |
Texas
|
26.6 | 9.8 | 80.7 | 1.3 |
| 16 |
Delaware
|
26.2 | 9.1 | 79.6 | 2.2 |
| 17 |
West Virginia
|
26.1 | 8.6 | 83.3 | 0.9 |
| 18 |
Arizona
|
25.8 | 11.0 | 76.1 | 1.7 |
| 19 |
Colorado
|
25.8 | 8.6 | 74.9 | 2.8 |
| 20 |
Louisiana
|
25.8 | 9.0 | 82.7 | 1.2 |
| 21 |
Tennessee
|
25.4 | 9.0 | 83.1 | 0.6 |
| 22 |
Rhode Island
|
25.3 | 8.1 | 81.3 | 2.2 |
| 23 |
Alabama
|
25.2 | 7.9 | 86.3 | 0.3 |
| 24 |
Mississippi
|
25.2 | 8.9 | 85.5 | 0.3 |
| 25 |
South Carolina
|
25.1 | 9.4 | 81.4 | 0.6 |
| 26 |
North Carolina
|
24.9 | 9.3 | 80.6 | 1.0 |
| 27 |
Michigan
|
24.6 | 8.9 | 82.0 | 1.4 |
| 28 |
Nevada
|
24.6 | 10.5 | 78.3 | 2.9 |
| 29 |
Maine
|
24.3 | 9.9 | 77.8 | 0.6 |
| 30 |
Indiana
|
23.9 | 8.9 | 82.9 | 0.9 |
| 31 |
Missouri
|
23.9 | 8.4 | 82.2 | 1.3 |
| 32 |
Oregon
|
23.9 | 9.5 | 71.7 | 4.2 |
| 33 |
Minnesota
|
23.8 | 8.4 | 77.7 | 3.5 |
| 34 |
Kentucky
|
23.7 | 9.4 | 82.4 | 1.0 |
| 35 |
Ohio
|
23.7 | 8.2 | 82.4 | 1.6 |
| 36 |
Vermont
|
23.3 | 9.0 | 75.4 | 0.9 |
| 37 |
New Mexico
|
22.7 | 11.2 | 79.3 | 1.1 |
| 38 |
Wisconsin
|
22.2 | 7.5 | 81.7 | 1.5 |
| 39 |
Oklahoma
|
22.0 | 9.5 | 82.5 | 0.5 |
| 40 |
Utah
|
22.0 | 11.1 | 75.7 | 2.2 |
| 41 |
Arkansas
|
21.8 | 10.4 | 82.6 | 0.4 |
| 42 |
Idaho
|
21.2 | 8.9 | 79.7 | 0.8 |
| 43 |
Kansas
|
19.6 | 9.3 | 82.0 | 0.5 |
| 44 |
Iowa
|
19.5 | 8.1 | 81.6 | 1.0 |
| 45 |
Alaska
|
18.9 | 12.3 | 68.0 | 1.2 |
| 46 |
Nebraska
|
18.9 | 8.7 | 82.1 | 0.6 |
| 47 |
Montana
|
18.4 | 9.5 | 74.9 | 0.8 |
| 48 |
Wyoming
|
17.9 | 10.2 | 75.8 | 1.2 |
| 49 |
North Dakota
|
17.6 | 8.7 | 82.2 | 0.7 |
| 50 |
South Dakota
|
17.3 | 8.8 | 81.1 | 0.2 |
No matching entries
Adjust the filter to show more entries.
Download as PDF
Print-ready table — Average Commute Time by State
States With the Longest and Shortest Commutes
Highest
Lowest
Top 10 Highest — Average Commute (min)
New York
 Maryland
 New Jersey
 Massachusetts
 California
 Illinois
 Georgia
 Virginia
 Washington
 Florida
Top 10 Lowest — Average Commute (min)
South Dakota
 North Dakota
 Wyoming
 Montana
 Nebraska
 Alaska
 Iowa
Iowa
 Kansas
 Idaho
Idaho
 Arkansas
States With the Longest Commute Times

New York ranks first at 33.5 minutes, followed by Maryland at 33.0 and New Jersey at 32.0. Massachusetts is fourth at 30.0, and California is fifth at 29.8.
Illinois also stays high at 29.0, while Georgia is at 28.7 and Virginia is at 28.6. The national mean was 27.2 minutes in the 2024 ACS summary, so each of those states sits above the U.S. figure.
States With the Shortest Commute Times

South Dakota has the shortest average commute at 17.3 minutes. North Dakota is next at 17.6, Wyoming is at 17.9, and Montana is at 18.4.
Alaska and Nebraska both post 18.9 minutes, while Iowa is at 19.5 and Kansas is at 19.6. Every state in that cluster stays well below the 27.2 minute national mean.
States With the Most Public Transit Commuters

New York has the highest public transit share at 28.0%, far ahead of New Jersey at 11.7% and Massachusetts at 10.2%. Illinois is also high at 9.4%, and Maryland reaches 7.9%.
Alabama and Mississippi are each at 0.3% public transit use, while South Dakota is at 0.2%. Alabama also has the highest drive solo share at 86.3%, and Hawaii has the highest carpool share at 14.7%.
Quick Answers
Which state has the longest average commute time?
Which state has the shortest average commute time?
What is the average commute time in California?
What is the average commute time in Texas?
Which state uses public transit the most for commuting?
Which state has the highest drive solo share?
Methodology
Average commute time, carpool share, drive solo share, and public transit share use the World Population Review 2026 state table shown from recent U.S. Census Bureau commuting data. The District of Columbia appears in the source table but is excluded here because this page ranks the 50 states only.
Sources
- U.S. Census Bureau. Commuting, Journey to Work
- U.S. Census Bureau. United States Commuting At A Glance
You Might Also Like

Most Popular Beer by State
Miller is the most popular beer in 29 states, while Coors leads 8. Budweiser wins Missouri and New Hampshire, and Bud Light leads Ohio and North Carolina.

Lightning by State
Florida ranks first at 244.1 lightning counts per square mile. Washington is lowest in the lower 48 at 2.1, and Alaska is lowest overall at 0.3.

Average Commute Time by State
New York has the longest average commute at 33.5 minutes. South Dakota is shortest at 17.3 minutes, and New Jersey is next highest at 32.0.

Most Popular Slang Word by State
Ope covers 9 Midwestern states. Y'all defines 8 Southern states. Wicked spans all 6 New England states. Jawn runs from Pennsylvania to Virginia.

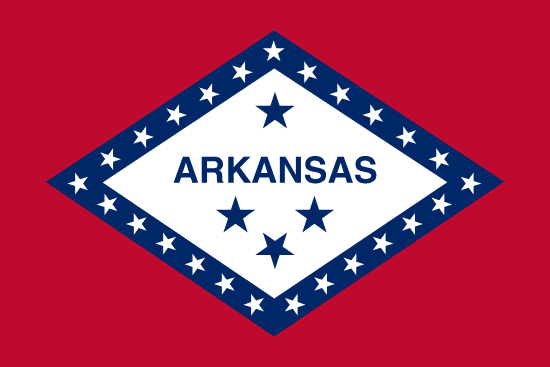
Flag of Arkansas
Arkansas had no state flag until 1913. Its white diamond marks the only diamond-producing state. A fourth star marks Confederate membership.

Flag of Arizona
Arizona's flag was sketched on an envelope in 1910 for a rifle team. Adopted in 1917, it became law without the governor's signature.

Flag of Alaska
Benny Benson designed Alaska's flag at 13. Eight gold stars on navy blue, the Big Dipper pointing to Polaris, adopted in 1927 and kept at statehood.

Alabama State Flag
Alabama's crimson cross on white was adopted in 1895, likely modeled after the Confederate Battle Flag. The state's first flag was destroyed by a storm one month after raising.