Unemployment Rate by State 2026

Unemployment Rate by State 2026
Ranking - Economy
Quick Answer
Unemployment Rate by State 2026
-
1
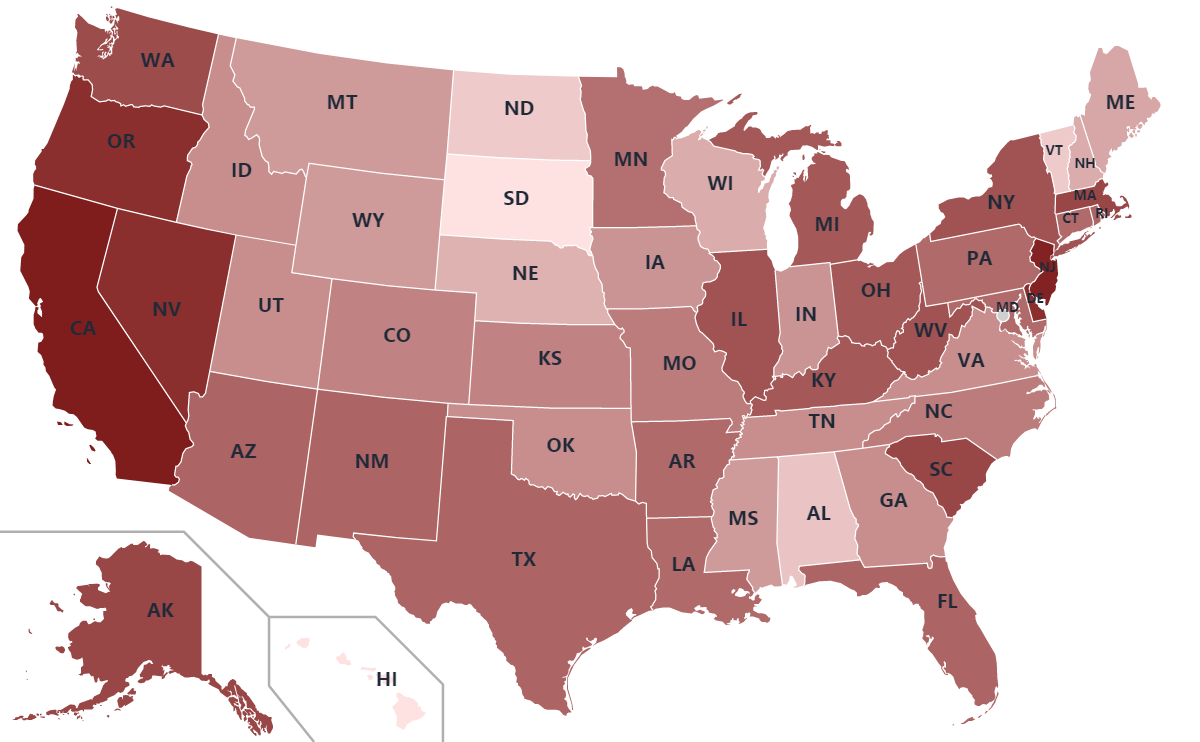
California has the highest unemployment rate at 5.5%, followed by New Jersey (5.4%) and Nevada (5.2%). All three states have large service and hospitality sectors sensitive to economic cycles.
-
2
Hawaii and South Dakota both record the lowest unemployment rates at 2.2%, followed by North Dakota and Vermont at 2.6%. These states have small, tight labor markets with limited seasonal volatility.
-
3
The national unemployment rate has ranged from 3.4% to 4.1% throughout 2024–2025 (BLS). Most states fall within two percentage points of that range; outliers on both ends reflect structural rather than cyclical factors.
Map
Unemployment Rate by State 2026 Map
| Rank | State | Unempl. Rate |
|---|---|---|
| 1 | California | 5.5 |
| 2 | New Jersey | 5.4 |
| 3 | Delaware | 5.2 |
| 4 | Nevada | 5.2 |
| 5 | Oregon | 5.2 |
| 6 | Alaska | 4.8 |
| 7 | Massachusetts | 4.8 |
| 8 | South Carolina | 4.8 |
| 9 | Washington | 4.7 |
| 10 | Illinois | 4.6 |
| 11 | New York | 4.6 |
| 12 | West Virginia | 4.6 |
| 13 | Kentucky | 4.5 |
| 14 | Michigan | 4.5 |
| 15 | Ohio | 4.5 |
| 16 | Arizona | 4.3 |
| 17 | Florida | 4.3 |
| 18 | New Mexico | 4.3 |
| 19 | Rhode Island | 4.3 |
| 20 | Texas | 4.3 |
| 21 | Arkansas | 4.2 |
| 22 | Connecticut | 4.2 |
| 23 | Louisiana | 4.2 |
| 24 | Maryland | 4.2 |
| 25 | Pennsylvania | 4.2 |
| 26 | Minnesota | 4.1 |
| 27 | Missouri | 3.9 |
| 28 | North Carolina | 3.9 |
| 29 | Colorado | 3.8 |
| 30 | Kansas | 3.8 |
| 31 | Georgia | 3.6 |
| 32 | Idaho | 3.6 |
| 33 | Oklahoma | 3.6 |
| 34 | Tennessee | 3.6 |
| 35 | Utah | 3.6 |
| 36 | Virginia | 3.6 |
| 37 | Indiana | 3.5 |
| 38 | Iowa | 3.5 |
| 39 | Mississippi | 3.4 |
| 40 | Montana | 3.4 |
| 41 | Wyoming | 3.4 |
| 42 | Maine | 3.2 |
| 43 | New Hampshire | 3.1 |
| 44 | Wisconsin | 3.1 |
| 45 | Nebraska | 3 |
| 46 | Alabama | 2.7 |
| 47 | North Dakota | 2.6 |
| 48 | Vermont | 2.6 |
| 49 | Hawaii | 2.2 |
| 50 | South Dakota | 2.2 |
Nevada and California show the deepest red. The Plains and Mountain states cluster at the light end. South Dakota and Nebraska are consistently the tightest labor markets in the country.
Unemployment Rate by State 2026 Table
50 entries


No matching entries
Adjust the filter to show more entries.
|
Rank
|
State
|
Unemployment Rate (%)
|
|---|---|---|
| 1 |
California
|
5.5 |
| 2 |
New Jersey
|
5.4 |
| 3 |
Delaware
|
5.2 |
| 4 |
Nevada
|
5.2 |
| 5 |
Oregon
|
5.2 |
| 6 |
Alaska
|
4.8 |
| 7 |
Massachusetts
|
4.8 |
| 8 |
South Carolina
|
4.8 |
| 9 |
Washington
|
4.7 |
| 10 |
Illinois
|
4.6 |
| 11 |
New York
|
4.6 |
| 12 |
West Virginia
|
4.6 |
| 13 |
Kentucky
|
4.5 |
| 14 |
Michigan
|
4.5 |
| 15 |
Ohio
|
4.5 |
| 16 |
Arizona
|
4.3 |
| 17 |
Florida
|
4.3 |
| 18 |
New Mexico
|
4.3 |
| 19 |
Rhode Island
|
4.3 |
| 20 |
Texas
|
4.3 |
| 21 |
Arkansas
|
4.2 |
| 22 |
Connecticut
|
4.2 |
| 23 |
Louisiana
|
4.2 |
| 24 |
Maryland
|
4.2 |
| 25 |
Pennsylvania
|
4.2 |
| 26 |
Minnesota
|
4.1 |
| 27 |
Missouri
|
3.9 |
| 28 |
North Carolina
|
3.9 |
| 29 |
Colorado
|
3.8 |
| 30 |
Kansas
|
3.8 |
| 31 |
Georgia
|
3.6 |
| 32 |
Idaho
|
3.6 |
| 33 |
Oklahoma
|
3.6 |
| 34 |
Tennessee
|
3.6 |
| 35 |
Utah
|
3.6 |
| 36 |
Virginia
|
3.6 |
| 37 |
Indiana
|
3.5 |
| 38 |
Iowa
|
3.5 |
| 39 |
Mississippi
|
3.4 |
| 40 |
Montana
|
3.4 |
| 41 |
Wyoming
|
3.4 |
| 42 |
Maine
|
3.2 |
| 43 |
New Hampshire
|
3.1 |
| 44 |
Wisconsin
|
3.1 |
| 45 |
Nebraska
|
3.0 |
| 46 |
Alabama
|
2.7 |
| 47 |
North Dakota
|
2.6 |
| 48 |
Vermont
|
2.6 |
| 49 |
Hawaii
|
2.2 |
| 50 |
South Dakota
|
2.2 |
No matching entries
Adjust the filter to show more entries.
Download as PDF
Print-ready table — Unemployment Rate by State 2026
States with the Highest and Lowest Unemployment Rates
Highest
Lowest
Top 10 Highest — Unemployment Rate (%)
California
 New Jersey
 Delaware
 Nevada
 Oregon
 Alaska
 Massachusetts
 South Carolina
 Washington
 Illinois
Top 10 Lowest — Unemployment Rate (%)
South Dakota
 Hawaii
 Vermont
 North Dakota
 Alabama
 Nebraska
 Wisconsin
 New Hampshire
 Maine
Maine
 Wyoming
Why the Dakotas and Hawaii Have the Lowest Unemployment

South Dakota and Hawaii both record unemployment rates of 2.2%, the lowest in the country. North Dakota is close at 2.6%. Both states have small, tight labor markets where agriculture, energy, and financial services provide stable year-round employment. North Dakota's oil patch in the Williston Basin generates demand for workers across drilling, logistics, and support industries.
Hawaii (2.2%) matches the Dakotas through a different mechanism: near-full employment in tourism and hospitality during the post-pandemic travel recovery. Vermont (2.6%) and Alabama (2.7%) follow. Population size plays a role, with fewer than 800,000 residents each, the Dakotas see measurable rate changes from relatively small shifts in hiring.
Why California Has the Highest Unemployment Rate

California's 5.5% unemployment rate reflects the structural complexity of a labor market with 19 million workers. The state's tech sector shed over 200,000 jobs in 2022 and 2023 through layoffs at companies including Meta, Google, Amazon, and Salesforce. Those workers entered the unemployment pool while seeking comparably specialized roles, extending the average duration of unemployment.
California also has a large share of workers in seasonal agriculture and entertainment production, both of which generate cyclical unemployment. New Jersey (5.4%) and Nevada (5.2%) follow California for different reasons: New Jersey has a large financial services sector sensitive to Wall Street cycles, while Nevada's casino and hospitality economy creates volatility tied to tourism spending.
What the Unemployment Rate Does Not Measure
The official unemployment rate counts only people who are actively looking for work. It excludes discouraged workers, people who want jobs but have stopped applying, as well as part-time workers who want full-time positions. States with high rates of labor force non-participation can show low unemployment figures despite widespread joblessness.
West Virginia illustrates this. Its unemployment rate is 4.6%, near the national average, but its employment-population ratio is only 55.8%, fewer than 56% of working-age adults are employed. Many West Virginians are neither employed nor classified as unemployed because they are not actively searching. The broader U-6 measure, which includes discouraged and underemployed workers, typically runs 3 to 4 points above the headline rate in states with high non-participation.
Quick Answers
Which state has the highest unemployment rate
Which state has the lowest unemployment rate
What counts as unemployed in the BLS data
Does a low unemployment rate mean the economy is strong
Methodology
Unemployment rates are seasonally adjusted annual averages from the Bureau of Labor Statistics (BLS) Local Area Unemployment Statistics (LAUS) program. The rate measures the percentage of the civilian labor force that is unemployed and actively seeking work.
Sources
Build A Comparison
Compare Unemployment Between Two States
Pick two states to see a side-by-side breakdown of employment, income, and economic data.
You Might Also Like

Serial Killers by State
Alaska has the highest serial killer rate at 0.867 per 100,000 residents. Hawaii is lowest, and California has the highest raw count at 128.

Flag of Arkansas
Arkansas had no state flag until 1913. Its white diamond marks the only diamond-producing state. A fourth star marks Confederate membership.

Flag of Arizona
Arizona's flag was sketched on an envelope in 1910 for a rifle team. Adopted in 1917, it became law without the governor's signature.

Flag of Alaska
Benny Benson designed Alaska's flag at 13. Eight gold stars on navy blue, the Big Dipper pointing to Polaris, adopted in 1927 and kept at statehood.

Alabama State Flag
Alabama's crimson cross on white was adopted in 1895, likely modeled after the Confederate Battle Flag. The state's first flag was destroyed by a storm one month after raising.

Flag of California
Brown grizzly on white, adopted in 1911, traces to settler William Todd's handmade flag raised at Sonoma on June 14, 1846.

Rainwater Harvesting Laws by State
Rainwater harvesting is legal in all 50 states. Colorado caps residential storage at 110 gallons, while Utah allows up to 2,500 gallons.

Weird Laws in Arkansas
Weird laws in Arkansas include a repealed statewide tattoo ban, a 145-year-old pronunciation law, and a Sunday car sales rule that is still enforced today.