Electoral Votes by State

Electoral Votes by State
Ranking - Government & Politics
Each state's electoral vote total equals its full congressional delegation: House seats plus two senators. That formula, rather than simple popular vote, determines the 538-vote Electoral College map.
Quick Answer
Electoral Votes by State
-
1
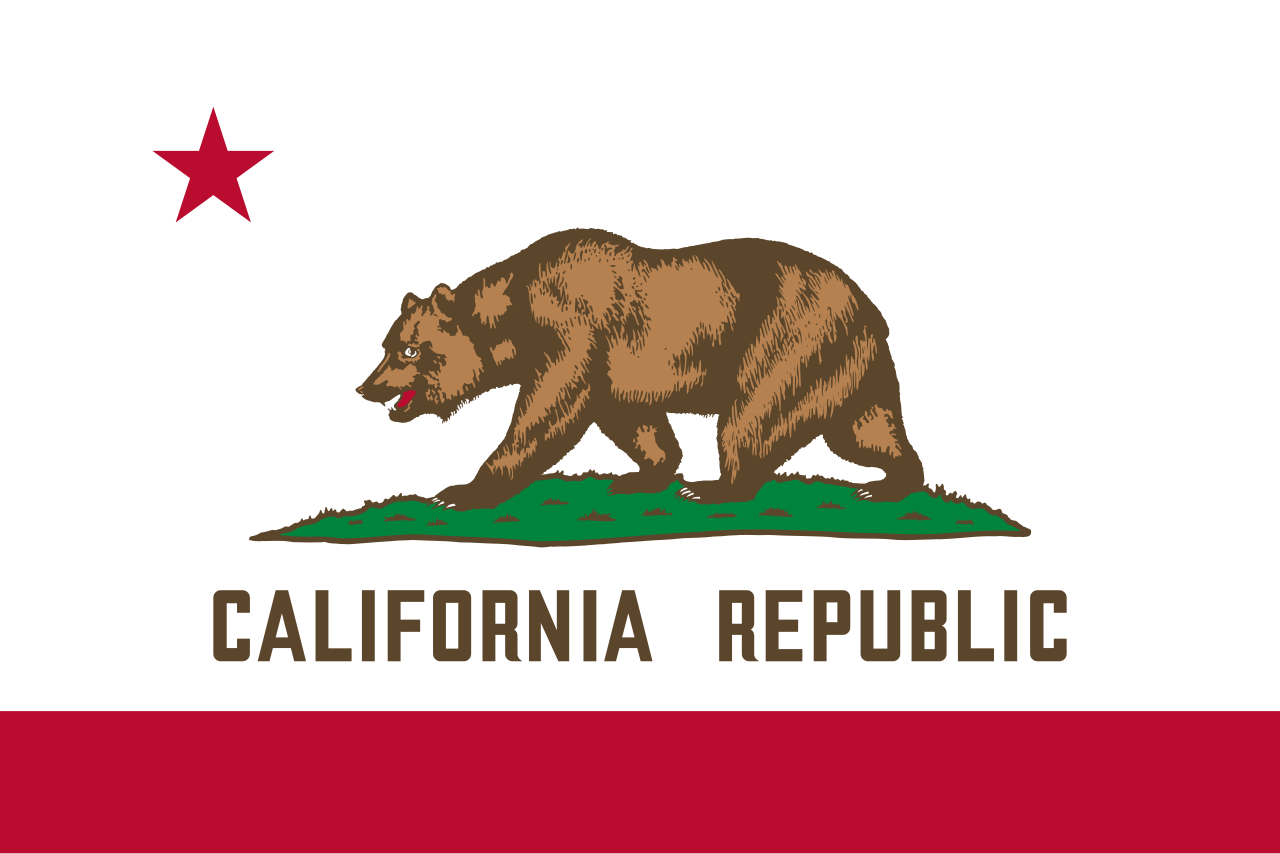
California holds the most electoral votes of any state at 54, representing 10% of the 538-vote total. Texas ranks second at 40, followed by Florida at 30 and New York at 28.
-
2
Wyoming, Alaska, Vermont, North Dakota, South Dakota, and Delaware each hold 3 electoral votes, the minimum guaranteed to every state. Six states share that floor.
-
3
A candidate needs 270 electoral votes to win the presidency. California, Texas, and Florida together control 124 votes, nearly 46% of the 270-vote threshold.
Map
Electoral Votes by State 2024 Map

| Rank | State | Electoral Votes |
|---|---|---|
| 1 | California | 54 |
| 2 | Texas | 40 |
| 3 | Florida | 30 |
| 4 | New York | 28 |
| 5 | Illinois | 19 |
| 5 | Pennsylvania | 19 |
| 7 | Ohio | 17 |
| 8 | Georgia | 16 |
| 8 | North Carolina | 16 |
| 10 | Michigan | 15 |
| 11 | New Jersey | 14 |
| 12 | Virginia | 13 |
| 13 | Washington | 12 |
| 14 | Arizona | 11 |
| 14 | Indiana | 11 |
| 14 | Massachusetts | 11 |
| 14 | Tennessee | 11 |
| 18 | Colorado | 10 |
| 18 | Maryland | 10 |
| 18 | Minnesota | 10 |
| 18 | Missouri | 10 |
| 18 | Wisconsin | 10 |
| 23 | Alabama | 9 |
| 23 | South Carolina | 9 |
| 25 | Kentucky | 8 |
| 25 | Louisiana | 8 |
| 25 | Oregon | 8 |
| 28 | Connecticut | 7 |
| 28 | Oklahoma | 7 |
| 30 | Arkansas | 6 |
| 30 | Iowa | 6 |
| 30 | Kansas | 6 |
| 30 | Mississippi | 6 |
| 30 | Nevada | 6 |
| 30 | Utah | 6 |
| 36 | Nebraska | 5 |
| 36 | New Mexico | 5 |
| 38 | Hawaii | 4 |
| 38 | Idaho | 4 |
| 38 | Maine | 4 |
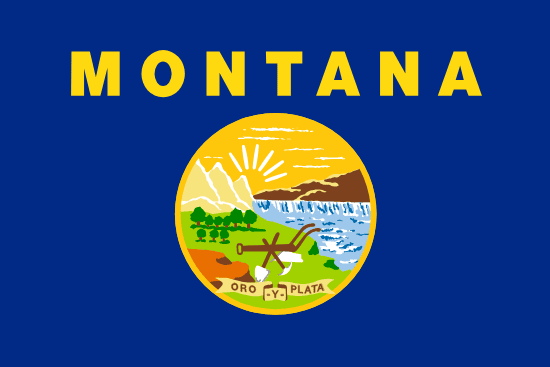
| 38 | Montana | 4 |
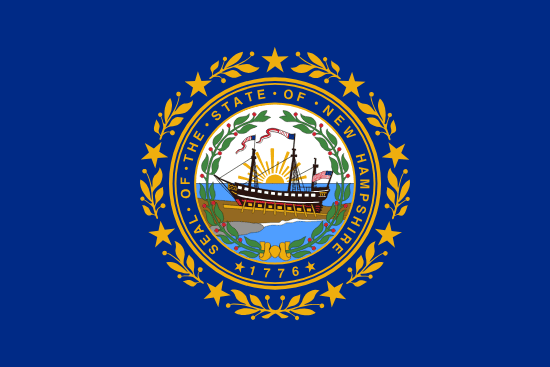
| 38 | New Hampshire | 4 |
| 38 | Rhode Island | 4 |
| 38 | West Virginia | 4 |
| 45 | Alaska | 3 |
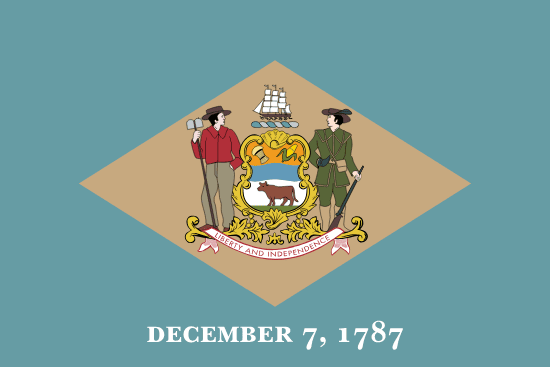
| 45 | Delaware | 3 |
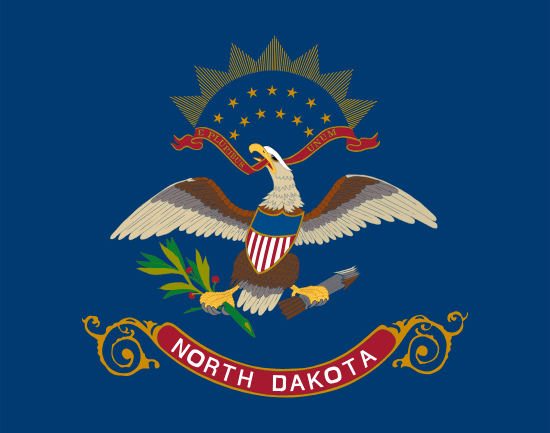
| 45 | North Dakota | 3 |
| 45 | South Dakota | 3 |
| 45 | Vermont | 3 |
| 45 | Wyoming | 3 |
California (54), Texas (40), and Florida (30) anchor the top of the map in deep teal. The six 3-vote states (Wyoming, Alaska, Vermont, North Dakota, South Dakota, and Delaware) appear nearly white at the bottom of the scale.
Electoral Votes by State Table
50 entries


No matching entries
Adjust the filter to show more entries.
|
Rank
|
State
|
Electoral Votes
|
% of 538 Total
|
|---|---|---|---|
| 1 |
California
|
54 | 10.0% |
| 2 |
Texas
|
40 | 7.4% |
| 3 |
Florida
|
30 | 5.6% |
| 4 |
New York
|
28 | 5.2% |
| 5 |
Illinois
|
19 | 3.5% |
| 5 |
Pennsylvania
|
19 | 3.5% |
| 7 |
Ohio
|
17 | 3.2% |
| 8 |
Georgia
|
16 | 3.0% |
| 8 |
North Carolina
|
16 | 3.0% |
| 10 |
Michigan
|
15 | 2.8% |
| 11 |
New Jersey
|
14 | 2.6% |
| 12 |
Virginia
|
13 | 2.4% |
| 13 |
Washington
|
12 | 2.2% |
| 14 |
Arizona
|
11 | 2.0% |
| 14 |
Indiana
|
11 | 2.0% |
| 14 |
Massachusetts
|
11 | 2.0% |
| 14 |
Tennessee
|
11 | 2.0% |
| 18 |
Colorado
|
10 | 1.9% |
| 18 |
Maryland
|
10 | 1.9% |
| 18 |
Minnesota
|
10 | 1.9% |
| 18 |
Missouri
|
10 | 1.9% |
| 18 |
Wisconsin
|
10 | 1.9% |
| 23 |
Alabama
|
9 | 1.7% |
| 23 |
South Carolina
|
9 | 1.7% |
| 25 |
Kentucky
|
8 | 1.5% |
| 25 |
Louisiana
|
8 | 1.5% |
| 25 |
Oregon
|
8 | 1.5% |
| 28 |
Connecticut
|
7 | 1.3% |
| 28 |
Oklahoma
|
7 | 1.3% |
| 30 |
Arkansas
|
6 | 1.1% |
| 30 |
Iowa
|
6 | 1.1% |
| 30 |
Kansas
|
6 | 1.1% |
| 30 |
Mississippi
|
6 | 1.1% |
| 30 |
Nevada
|
6 | 1.1% |
| 30 |
Utah
|
6 | 1.1% |
| 36 |
Nebraska
|
5 | 0.9% |
| 36 |
New Mexico
|
5 | 0.9% |
| 38 |
Hawaii
|
4 | 0.7% |
| 38 |
Idaho
|
4 | 0.7% |
| 38 |
Maine
|
4 | 0.7% |
| 38 |
Montana
|
4 | 0.7% |
| 38 |
New Hampshire
|
4 | 0.7% |
| 38 |
Rhode Island
|
4 | 0.7% |
| 38 |
West Virginia
|
4 | 0.7% |
| 45 |
Alaska
|
3 | 0.6% |
| 45 |
Delaware
|
3 | 0.6% |
| 45 |
North Dakota
|
3 | 0.6% |
| 45 |
South Dakota
|
3 | 0.6% |
| 45 |
Vermont
|
3 | 0.6% |
| 45 |
Wyoming
|
3 | 0.6% |
No matching entries
Adjust the filter to show more entries.
Download this table as a PDF
Clean, print-ready version of Electoral Votes by State.
Most and Fewest Electoral Votes by State
Highest
Lowest
Top 10 Highest — Electoral Votes
California
 Texas
Texas
 Florida
 New York
 Illinois
 Pennsylvania
 Ohio
Ohio
 Georgia
 North Carolina
 Michigan
Top 10 Lowest — Electoral Votes
Wyoming
 Vermont
 South Dakota
 North Dakota
 Delaware
 Alaska
 West Virginia
 Rhode Island
 New Hampshire
 Montana
States with the Most Electoral Votes

California's 54 electoral votes are the most of any state, 18 times Wyoming's minimum of 3. Texas follows at 40 and Florida at 30, making the top three states alone worth 124 votes, nearly 23% of the 538 total and 46% of the 270 needed to win.
New York, with 28 votes, completes the top four. Together, California, Texas, Florida, and New York control 152 electoral votes, more than 28% of the Electoral College. A candidate who carries all four still needs 118 additional votes to reach a majority.
States with the Fewest Electoral Votes

Six states hold 3 electoral votes each: Wyoming, Alaska, Vermont, North Dakota, South Dakota, and Delaware. Combined, those six states total 18 votes, exactly one-third of California's 54. All six appear in the bottom tier because each state's count starts at a floor of 3 regardless of population size.
Seven additional states hold 4 votes each: Hawaii, Idaho, Maine, Montana, New Hampshire, Rhode Island, and West Virginia. That places 13 states at 4 or fewer electoral votes, accounting for just 46 votes, less than 9% of the 538-vote total.
Electoral Votes in Battleground States

Georgia and North Carolina each hold 16 electoral votes, tied for 8th in the table. Michigan sits just above at 15, Arizona and Wisconsin at 11 and 10 respectively. Pennsylvania, at 19, is the largest single state among perennial battlegrounds in the table.
Nevada holds 6 votes (tied for 30th), making it one of the smallest contested states by electoral weight. Arizona's 11 and Georgia's 16 represent a 5-vote gap between two states that have appeared on both sides of recent presidential results.
Quick Answers
How many electoral votes does California have?
How many electoral votes does Texas have in 2024?
Which state has the fewest electoral votes?
How many electoral votes are needed to win the presidency?
How many electoral votes does Florida have?
How many electoral votes does Pennsylvania have?
What is the total number of electoral votes in the United States?
Methodology
Each state's electoral vote total equals its full congressional delegation (House seats plus 2 senators), based on 2020 Census reapportionment; these totals apply to both the 2024 and 2028 presidential elections. Maine and Nebraska may split some votes by congressional district; this table shows the statewide allocation for each. Source: U.S. National Archives.
Sources
- U.S. National Archives — Electoral College Allocation
- U.S. Census Bureau — 2020 Apportionment Results
Build A Comparison
Compare Electoral Votes Between Two States
Pick any two states to see a full side-by-side breakdown of electoral votes, population, congressional seats, and more.
You Might Also Like

Concealed Carry Laws by State 2026
29 states allow permitless carry in 2026. Carry status, permit requirements, and reciprocity counts for all 50 states.

Abortion Laws by State 2026
13 states have total abortion bans after Dobbs. Gestational limits, waiting periods, and provider access for all 50 states.

Marijuana Laws by State 2026
24 states have legalized recreational marijuana in 2026. Possession limits, decriminalization, and medical access for all 50 states.

Red States, Blue States, and Swing States
24 states voted solidly Republican and 13 solidly Democratic in 2024. Pennsylvania, Michigan, and Wisconsin are the three closest swing states.

Electoral Votes by State
California leads all states with 54 electoral votes out of 538 total. See every state's electoral college count for the 2024 presidential elections.

Basilosaurus Whale
The Alabama state fossil is the Basilosaurus Whale (Basilosaurus cetoides), adopted in 1984. Fossils are found in southwest Alabama's Eocene deposits.

Petrified Wood
The Arizona state fossil is Petrified Wood (Araucarioxylon arizonicum), adopted in 1988. Fossil logs are found throughout Petrified Forest National Park.

Colorado State Colors
Official Colorado state colors are Blue and White, adopted in 1911. Blue reflects the sky and the columbine, white the Rocky Mountain snow.