Key takeaways
Road Quality by State
Road quality by state is highest in New
New Hampshire
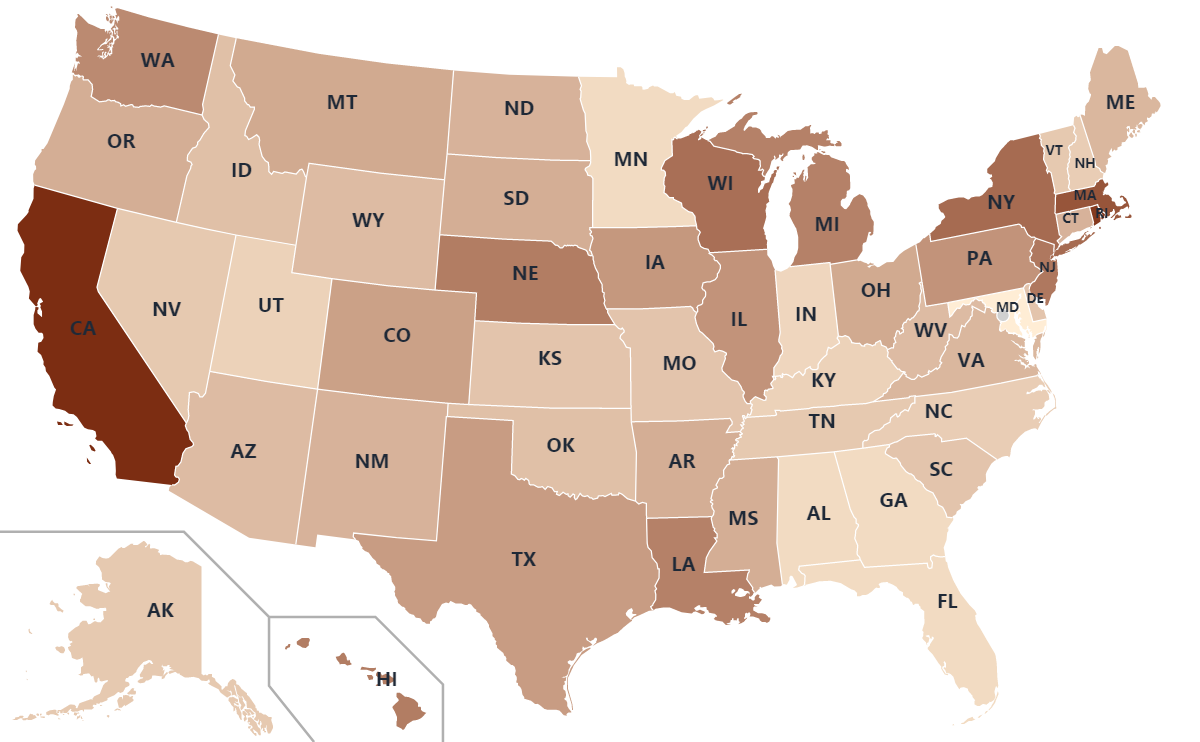
Road quality by state is highest in New Hampshire, ranked first with 8% rough urban pavement and 3% rural. Minnesota and Vermont follow in second and third.
Hawaii ranks last at 50th, with
Hawaii
Hawaii ranks last at 50th, with 26% of urban and 16% of rural pavement rated rough. Rhode Island sits 49th, and 37.2% of its major roads are in poor condition, the largest share nationally.
California's
California
California's 44% rough urban pavement is the highest in the country, against just 5% on its rural roads. Nationally, 13.1% of major roads were in poor condition in 2024, up from 11.8% in 2000.
Map
Road Quality by State Map
| Rank | State | % Rough Urban Pavement |
|---|---|---|
| 1 | New Hampshire | 8 |
| 2 | Minnesota | 5 |
| 3 | Vermont | 9 |
| 4 | Alabama | 5 |
| 5 | Idaho | 11 |
| 6 | Kansas | 10 |
| 7 | Florida | 5 |
| 8 | Georgia | 5 |
| 9 | Nevada | 9 |
| 10 | Indiana | 6 |
| 11 | Utah | 7 |
| 12 | Tennessee | 9 |
| 13 | Missouri | 10 |
| 14 | Maryland | 1 |
| 15 | North Dakota | 14 |
| 16 | Delaware | 10 |
| 17 | Ohio | 16 |
| 18 | Maine | 13 |
| 19 | North Carolina | 8 |
| 20 | Kentucky | 7 |
| 21 | Oregon | 15 |
| 22 | Virginia | 13 |
| 23 | Connecticut | 14 |
| 24 | New Jersey | 27 |
| 25 | Pennsylvania | 21 |
| 26 | New Mexico | 14 |
| 27 | Wyoming | 12 |
| 28 | South Dakota | 15 |
| 29 | Montana | 16 |
| 30 | Oklahoma | 11 |
| 31 | Michigan | 25 |
| 32 | Alaska | 9 |
| 33 | New York | 30 |
| 34 | Washington | 23 |
| 35 | Arizona | 12 |
| 36 | Texas | 19 |
| 37 | West Virginia | 12 |
| 38 | Illinois | 21 |
| 39 | Massachusetts | 35 |
| 40 | Nebraska | 26 |
| 41 | Iowa | 20 |
| 42 | South Carolina | 10 |
| 43 | Colorado | 18 |
| 44 | Arkansas | 15 |
| 45 | Mississippi | 15 |
| 46 | Wisconsin | 29 |
| 47 | California | 44 |
| 48 | Louisiana | 25 |
| 49 | Rhode Island | 41 |
| 50 | Hawaii | 26 |
California has the roughest urban pavement at 44%, followed by Rhode Island at 41% and Massachusetts at 35%. Maryland's 1% is the lowest in the country.
Road Quality by State Table


No matching entries
Adjust the filter to show more entries.
|
Rank
|
State
|
Rough Urban Pavement
|
Rough Rural Pavement
|
|---|---|---|---|
| 1 |
New Hampshire
|
8% | 3% |
| 2 |
Minnesota
|
5% | 3% |
| 3 |
Vermont
|
9% | 4% |
| 4 |
Alabama
|
5% | 1% |
| 5 |
Idaho
|
11% | 5% |
| 6 |
Kansas
|
10% | 1% |
| 7 |
Florida
|
5% | 1% |
| 8 |
Georgia
|
5% | 1% |
| 9 |
Nevada
|
9% | 1% |
| 10 |
Indiana
|
6% | 2% |
| 11 |
Utah
|
7% | 2% |
| 12 |
Tennessee
|
9% | 2% |
| 13 |
Missouri
|
10% | 1% |
| 14 |
Maryland
|
1% | 3% |
| 15 |
North Dakota
|
14% | 2% |
| 16 |
Delaware
|
10% | 2% |
| 17 |
Ohio
|
16% | 2% |
| 18 |
Maine
|
13% | 6% |
| 19 |
North Carolina
|
8% | 1% |
| 20 |
Kentucky
|
7% | 2% |
| 21 |
Oregon
|
15% | 2% |
| 22 |
Virginia
|
13% | 2% |
| 23 |
Connecticut
|
14% | 4% |
| 24 |
New Jersey
|
27% | 5% |
| 25 |
Pennsylvania
|
21% | 4% |
| 26 |
New Mexico
|
14% | 4% |
| 27 |
Wyoming
|
12% | 2% |
| 28 |
South Dakota
|
15% | 3% |
| 29 |
Montana
|
16% | 3% |
| 30 |
Oklahoma
|
11% | 6% |
| 31 |
Michigan
|
25% | 3% |
| 32 |
Alaska
|
9% | 16% |
| 33 |
New York
|
30% | 4% |
| 34 |
Washington
|
23% | 5% |
| 35 |
Arizona
|
12% | 4% |
| 36 |
Texas
|
19% | 2% |
| 37 |
West Virginia
|
12% | 7% |
| 38 |
Illinois
|
21% | 6% |
| 39 |
Massachusetts
|
35% | 4% |
| 40 |
Nebraska
|
26% | 16% |
| 41 |
Iowa
|
20% | 6% |
| 42 |
South Carolina
|
10% | 3% |
| 43 |
Colorado
|
18% | 5% |
| 44 |
Arkansas
|
15% | 6% |
| 45 |
Mississippi
|
15% | 3% |
| 46 |
Wisconsin
|
29% | 6% |
| 47 |
California
|
44% | 5% |
| 48 |
Louisiana
|
25% | 7% |
| 49 |
Rhode Island
|
41% | 17% |
| 50 |
Hawaii
|
26% | 16% |
No matching entries
Adjust the filter to show more entries.
Best and Worst Roads by State
Highest
1
 New Hampshire
Lowest
50
 Hawaii
Top 10 Highest — Rank







Top 10 Lowest — Rank






States with the Best Roads

New Hampshire ranks first, with 8% of urban pavement and 3% of rural pavement rated rough. Minnesota follows in second at 5% urban, and it also posts the country's best urban fatality rate.
Alabama, Florida, Georgia, Kansas, Missouri, Nevada, and North Carolina keep rural roughness at just 1%. Reason Foundation's cost-effectiveness ranking puts Virginia and Georgia at the top nationally.
States with the Worst Roads

Hawaii ranks 50th, with 26% of urban and 16% of rural pavement rated rough. Rhode Island at 49th combines 41% rough urban pavement with 17% rural, the worst rural figure in the country.
Rhode Island also leads the FHWA poor-pavement measure, with 37.2% of its major roads in poor condition. Massachusetts follows at 27%, California at 26.6%, and Hawaii at 26.5%, against a national average of 13.1%.
Urban vs Rural Road Conditions

California shows the widest urban-rural gap, with 44% of urban pavement rated rough, the highest share in the country, against just 5% on rural roads. New York runs 30% urban versus 4% rural.
Alaska and Maryland reverse the pattern. Alaska's rural roads are rougher at 16% versus 9% urban, and Maryland pairs the nation's best urban figure of 1% with 3% rural.
Highway Spending by State

Massachusetts, New York, and New Jersey each spent more than $250,000 per lane-mile, the highest rates in the Reason Foundation report. Missouri, South Carolina, West Virginia, North Dakota, and South Dakota spent less than $30,000.
Money alone does not buy smooth pavement. Massachusetts ranks 39th for road quality despite its top-tier spending, while low-spending Missouri sits 13th.
Road Fatalities by State

Alaska, South Carolina, and Hawaii post the highest rural fatality rates, each above 1.80 deaths per 100 million vehicle-miles. Half the states exceed 1.0 on urban roads, including New Mexico, Wyoming, and Mississippi.
Minnesota records the best urban fatality rate in the country, and Maryland has the lowest rural rate. Both states also place in the top 15 for pavement quality.
Quick Answers
Which state has the worst roads?
Which state has the best roads?
What percentage of US roads are in poor condition?
Which states spend the most on roads?
Which state has the highest road fatality rate?
Are roads worse in cities or rural areas?
Methodology
Rankings use the ConsumerAffairs 2023 road conditions study, with the share of rough urban and rural pavement per state. Poor-pavement, spending, and fatality figures come from FHWA data and the Reason Foundation Annual Highway Report.
Sources
- Construction Coverage — U.S. States With the Worst Roads
- Reason Foundation — 29th Annual Highway Report
Compare all 50 states by population, land area, statehood date, and more.
Themed lists - states sharing the same bird, oldest symbols, flags with bears, and more.
Side-by-side comparison of population, area, income, taxes, climate, and more.
Top 20 most common surnames per state - with origins, meanings, and heritage context. Is yours on the list?


