Life Expectancy by State

Life Expectancy by State
Ranking - Health
Quick Answer
Life Expectancy by State
-
1
Hawaii has the longest life expectancy of any U.S. state at 81.6 years, attributed to low smoking rates, a diet high in fish and vegetables, near-universal health coverage, and strong community social bonds.
-
2
Mississippi has the lowest life expectancy at roughly 71.9 years — nearly a nine-year gap from Hawaii. West Virginia, Louisiana, Alabama, and Kentucky also rank near the bottom, reflecting higher rates of chronic disease, obesity, smoking, and limited access to health care.
-
3
The national average life expectancy at birth is approximately 76.4 years (CDC 2021), which is below many peer nations. The COVID-19 pandemic caused a two-year decline in U.S. life expectancy between 2019 and 2021.
Map
Life Expectancy by State 2026 Map
| Rank | State | Years |
|---|---|---|
| 1 | Hawaii | 81.6 |
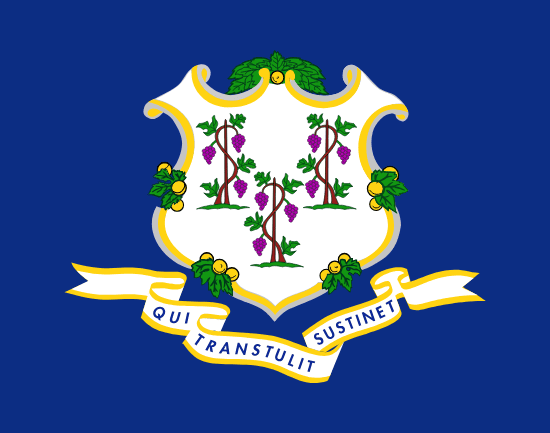
| 2 | Connecticut | 80.7 |
| 3 | Utah | 80.4 |
| 4 | Minnesota | 80.1 |
| 5 | Massachusetts | 80 |
| 6 | Vermont | 80 |
| 7 | Washington | 79.8 |
| 8 | Colorado | 79.7 |
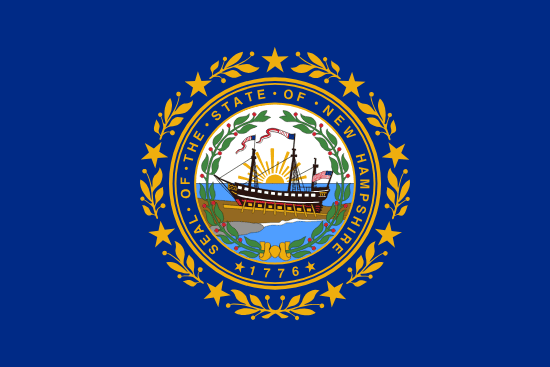
| 9 | New Hampshire | 79.5 |
| 10 | New York | 79.4 |
| 11 | New Jersey | 79.3 |
| 12 | California | 79.2 |
| 13 | Oregon | 79 |
| 14 | Idaho | 78.9 |
| 15 | Nebraska | 78.8 |
| 16 | Maine | 78.7 |
| 17 | North Dakota | 78.7 |
| 18 | Rhode Island | 78.6 |
| 19 | South Dakota | 78.5 |
| 20 | Wisconsin | 78.3 |
| 21 | Iowa | 78.1 |
| 22 | Montana | 77.9 |
| 23 | Virginia | 77.9 |
| 24 | Wyoming | 77.9 |
| 25 | Maryland | 77.6 |
| 26 | Illinois | 77.5 |
| 27 | Florida | 77.1 |
| 28 | Kansas | 77 |
| 29 | Delaware | 76.9 |
| 30 | Pennsylvania | 76.7 |
| 31 | Arizona | 76.6 |
| 32 | Texas | 76.2 |
| 33 | Nevada | 75.9 |
| 34 | Michigan | 75.8 |
| 35 | North Carolina | 75.7 |
| 36 | Missouri | 75.5 |
| 37 | Alaska | 75.4 |
| 38 | Georgia | 75.2 |
| 39 | Indiana | 75.1 |
| 40 | Ohio | 75.1 |
| 41 | South Carolina | 75 |
| 42 | New Mexico | 74.1 |
| 43 | Oklahoma | 73.8 |
| 44 | Tennessee | 73.8 |
| 45 | Kentucky | 73.5 |
| 46 | Arkansas | 73.4 |
| 47 | Alabama | 73.2 |
| 48 | Louisiana | 73.1 |
| 49 | West Virginia | 72.8 |
| 50 | Mississippi | 71.9 |
Hawaii and the Northeast cluster at the top. The Deep South and Appalachian states are the lightest -- a gap of nearly 9 years separates the best and worst states.
Life Expectancy by State Table
50 entries


No matching entries
Adjust the filter to show more entries.
|
Rank
|
State
|
Life Expectancy (years)
|
|---|---|---|
| 1 |
Hawaii
|
81.6 |
| 2 |
Connecticut
|
80.7 |
| 3 |
Utah
|
80.4 |
| 4 |
Minnesota
|
80.1 |
| 5 |
Massachusetts
|
80.0 |
| 6 |
Vermont
|
80.0 |
| 7 |
Washington
|
79.8 |
| 8 |
Colorado
|
79.7 |
| 9 |
New Hampshire
|
79.5 |
| 10 |
New York
|
79.4 |
| 11 |
New Jersey
|
79.3 |
| 12 |
California
|
79.2 |
| 13 |
Oregon
|
79.0 |
| 14 |
Idaho
|
78.9 |
| 15 |
Nebraska
|
78.8 |
| 16 |
Maine
|
78.7 |
| 17 |
North Dakota
|
78.7 |
| 18 |
Rhode Island
|
78.6 |
| 19 |
South Dakota
|
78.5 |
| 20 |
Wisconsin
|
78.3 |
| 21 |
Iowa
|
78.1 |
| 22 |
Montana
|
77.9 |
| 23 |
Virginia
|
77.9 |
| 24 |
Wyoming
|
77.9 |
| 25 |
Maryland
|
77.6 |
| 26 |
Illinois
|
77.5 |
| 27 |
Florida
|
77.1 |
| 28 |
Kansas
|
77.0 |
| 29 |
Delaware
|
76.9 |
| 30 |
Pennsylvania
|
76.7 |
| 31 |
Arizona
|
76.6 |
| 32 |
Texas
|
76.2 |
| 33 |
Nevada
|
75.9 |
| 34 |
Michigan
|
75.8 |
| 35 |
North Carolina
|
75.7 |
| 36 |
Missouri
|
75.5 |
| 37 |
Alaska
|
75.4 |
| 38 |
Georgia
|
75.2 |
| 39 |
Indiana
|
75.1 |
| 40 |
Ohio
|
75.1 |
| 41 |
South Carolina
|
75.0 |
| 42 |
New Mexico
|
74.1 |
| 43 |
Oklahoma
|
73.8 |
| 44 |
Tennessee
|
73.8 |
| 45 |
Kentucky
|
73.5 |
| 46 |
Arkansas
|
73.4 |
| 47 |
Alabama
|
73.2 |
| 48 |
Louisiana
|
73.1 |
| 49 |
West Virginia
|
72.8 |
| 50 |
Mississippi
|
71.9 |
No matching entries
Adjust the filter to show more entries.
Download this table as a PDF
Clean, print-ready version of Life Expectancy by State.
States with the Highest and Lowest Life Expectancy
Highest

Lowest

Top 10 Highest — Life Expectancy (years)
Hawaii
 Connecticut
 Utah
Utah
 Minnesota
 Massachusetts
 Vermont
 Washington
 Colorado
 New Hampshire
 New York
Top 10 Lowest — Life Expectancy (years)
Mississippi
 West Virginia
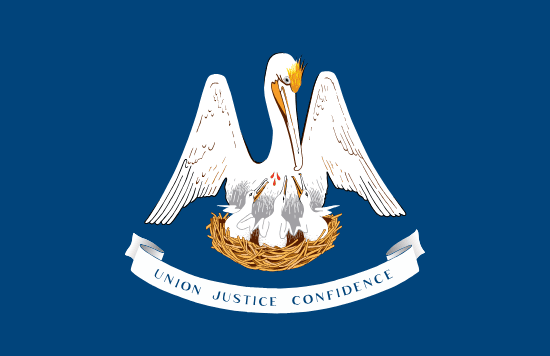 Louisiana
 Alabama
 Arkansas
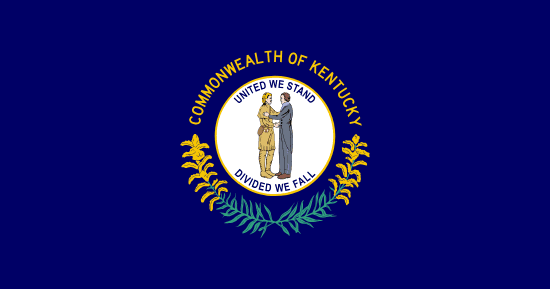 Kentucky
 Tennessee
 Oklahoma
 New Mexico
 South Carolina
Why Hawaii Has the Longest Life Expectancy

Hawaii's 81.6-year life expectancy, more than two years above the next-ranked state, reflects a combination of diet, lifestyle, and access. The state has the lowest obesity rate in the country at 27% and a traditional diet higher in fish, vegetables, and rice than the typical American diet. Smoking rates are among the lowest nationally. Outdoor physical activity is accessible year-round due to the climate.
Hawaii also has the second-lowest uninsured rate in the country at 3.2%, behind only Massachusetts (2.6%), ensuring that most residents receive preventive care and manage chronic conditions before they become fatal. The state's relatively small and tightly connected communities maintain high rates of social engagement, which research consistently links to lower mortality. Connecticut (80.7) and Utah (80.4) are the only other states averaging above 80 years.
Why Mississippi Has the Shortest Life Expectancy
Mississippi's 71.9-year life expectancy is nearly 10 years below Hawaii's and reflects overlapping disadvantages. The state has the second-highest obesity rate at 40.4% (West Virginia is highest at 41.4%), and the highest rates of diabetes, and high rates of heart disease and stroke. Poverty, at 18% of residents, limits access to nutritious food, preventive care, and safe environments for physical activity.
Mississippi has not expanded Medicaid under the Affordable Care Act, leaving a significant share of low-income adults without health coverage. Uninsured adults are less likely to receive cancer screenings, blood pressure management, or diabetes monitoring, all conditions that become fatal when untreated. West Virginia (72.8) and Louisiana (73.1) follow Mississippi for similar combinations of high poverty, high obesity, and limited healthcare access.
The Stroke Belt: Why the Deep South Clusters at the Bottom
Eight of the ten states with the shortest life expectancy are in the South: Mississippi, West Virginia, Louisiana, Alabama, Arkansas, Oklahoma, Kentucky, and Tennessee. Public health researchers have documented elevated rates of cardiovascular disease mortality in the region from eastern Arkansas through the Carolinas since the 1960s.
The geographic concentration reflects shared dietary patterns high in sodium and saturated fat, limited access to fresh produce in rural areas, high smoking rates, and historical gaps in healthcare infrastructure. The region also has lower rates of Medicaid expansion than the rest of the country, which limits preventive care for low-income residents.
Utah Ranks 3rd Despite Not Being Wealthy or Coastal

Utah's 80.4-year life expectancy places it third nationally, ahead of Massachusetts and Minnesota. Utah is not a high-income state relative to those neighbors, its median household income is near the national average, and it lacks the coastal healthcare infrastructure of Massachusetts or Connecticut. The explanation is primarily behavioral.
About 62% of Utah residents are members of The Church of Jesus Christ of Latter-day Saints, a faith tradition that prohibits tobacco, alcohol, and illicit drug use. Utah has the lowest smoking rate in the country at around 9% and among the lowest alcohol consumption rates. These behaviors directly affect the leading causes of premature death. The state also has a young population median age, which raises life expectancy figures mechanically, though age-adjusted data still shows Utah performing well.
Quick Answers
Which state has the highest life expectancy
Which state has the lowest life expectancy
Why did U.S. life expectancy drop in 2020–2021
What factors most influence life expectancy at the state level
Methodology
Life expectancy figures are from the CDC National Center for Health Statistics (NCHS), 2021 state-level estimates. Life expectancy at birth represents the average number of years a person born in that state could expect to live under current age-specific mortality rates. 2021 data reflects the first full year of COVID-19 mortality impact.
Sources
Build A Comparison
Compare Life Expectancy Between Two States
Pick two states to see a full side-by-side breakdown of health, income, education, and quality of life.
You Might Also Like

Stand Your Ground Laws by State
30 states have statutory Stand Your Ground laws with no duty to retreat. 11 states require retreat before using deadly force in public.

Best Healthcare by State
Hawaii leads all states with a healthcare score of 87.6. Alaska ranks last at 27.8, with West Virginia and Mississippi also below 30.

Squatters Rights by State
Arizona has one of the shortest adverse possession periods at 3 years, while New Jersey and Texas require up to 30 years.

Age of Consent by State
32 states set the age of consent at 16. California and Florida require 18. Romeo and Juliet exemption status for all 50 states.

Basilosaurus Whale
The Alabama state fossil is the Basilosaurus Whale (Basilosaurus cetoides), adopted in 1984. Fossils are found in southwest Alabama's Eocene deposits.

Petrified Wood
The Arizona state fossil is Petrified Wood (Araucarioxylon arizonicum), adopted in 1988. Fossil logs are found throughout Petrified Forest National Park.

Colorado State Colors
Official Colorado state colors are Blue and White, adopted in 1911. Blue reflects the sky and the columbine, white the Rocky Mountain snow.

Alabama State Colors
Crimson and white are Alabama's traditional state colors, taken from the 1895 state flag's wide saltire cross on a white field.