Connecticut vs Delaware: Livability Score
Connecticut has a higher livability score than Delaware.


National Rankings
Where They Rank Nationally
See where both states fall among all 50 states for livability score.
Top 10 States — Livability Score
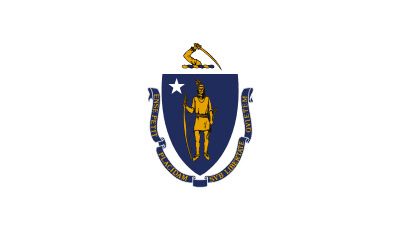 Massachusetts
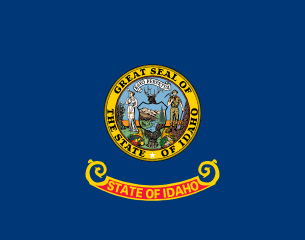 Idaho
Idaho
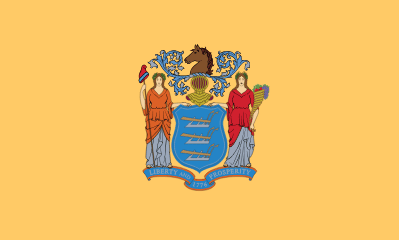 New Jersey
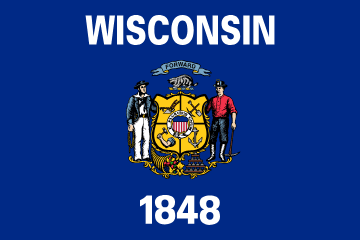 Wisconsin
 Minnesota
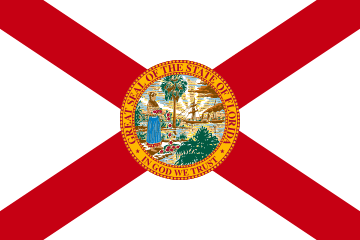 Florida
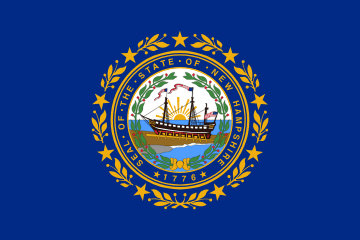 New Hampshire
 New York
 Utah
Utah
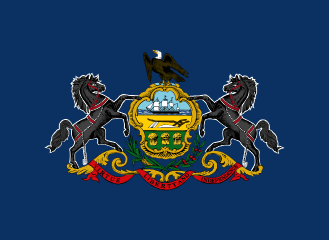 Pennsylvania
 Connecticut
 Delaware
Connecticut ranks 24th and Delaware ranks 33rd nationally for livability score.
Related Context
What Drives the Score
The livability score synthesizes several quality-of-life signals — here are the key inputs.
What This Means
Connecticut vs Delaware: Livability Score in context
Connecticut has a livability score of 52.09, compared with 50.03 in Delaware. Best States to Live In total score (August 11, 2025).
People Also Ask
Connecticut vs Delaware Livability Score — Common Questions
Q What is Connecticut's livability score?
Connecticut's livability score is 52.09.
Q What is Delaware's livability score?
Delaware's livability score is 50.03.
Q Which state has a higher livability score — Connecticut or Delaware?
Connecticut has a higher livability score than Delaware.
More Comparisons: Connecticut vs Delaware
Grouped tabs keep the deep-dive links tighter and easier to scan.
Explore Each State
 Connecticut Symbols
 Delaware Symbols
Sources: Core demographic data comes from the 2020 U.S. Census, with land area from U.S. Census Bureau TIGER files. Income, housing, affordability, and tax fields are maintained in our comparison dataset; purchasing-power figures use BEA Regional Price Parities. Minimum wage data comes from the U.S. Department of Labor, gas prices from AAA, and electricity rates from the U.S. Energy Information Administration. Political control and election fields use 2024 presidential results together with National Conference of State Legislatures data. Gun-law labels use the Giffords scorecard, alcohol system data comes from NABCA, and marijuana status uses NCSL's state cannabis laws tracker.